How to Perform Signal Processing and Filtering in MATLAB
Signal processing and filtering play a crucial role in various fields, including telecommunications, audio processing, biomedical engineering, and more. MATLAB, with its extensive set of built-in functions and toolboxes, provides powerful capabilities for signal processing and filtering tasks. In this comprehensive article, we will explore various techniques, methods, and best practices for performing signal processing and filtering in MATLAB.
Table of Contents
- Introduction to Signal Processing
- Basics of Signals
- Signal Representation in MATLAB
- Signal Generation and Sampling
- Signal Analysis and Visualization
- Time-Domain Filtering
- Frequency-Domain Filtering
- Windowing and Spectral Analysis
- Discrete Fourier Transform (DFT) and Fast Fourier Transform (FFT)
- FIR and IIR Filter Design
- Adaptive Filters
- Wavelet Transform
- Practical Applications
- Best Practices and Tips
- Conclusion
1. Introduction to Signal Processing
Signal processing involves analyzing, modifying, and interpreting signals to extract useful information or enhance specific characteristics. Signals can be analog or digital and may represent various phenomena such as audio, video, images, biomedical data, and more. Signal processing techniques aim to improve signal quality, remove noise, extract features, and detect patterns.
2. Basics of Signals
Signals can be classified based on their domain (time or frequency) and nature (continuous or discrete). Common types of signals include:
- Continuous-time signals: Functions of time that are defined for all values of time within a specified interval.
- Discrete-time signals: Sequences of values defined only at discrete time instants.
3. Signal Representation in MATLAB
In MATLAB, signals can be represented using arrays or matrices. Time-domain signals are typically represented as vectors, while frequency-domain signals are represented using complex numbers or polar coordinates.
matlab
Copy code
% Generate a sine wave t = 0:0.01:1; f = 5; % Frequency (Hz) A = 1; % Amplitude y = A * sin(2*pi*f*t); % Plot the signal plot(t, y); xlabel('Time (s)'); ylabel('Amplitude'); title('Sine Wave');
4. Signal Generation and Sampling
MATLAB provides functions for generating various types of signals, including sine waves, square waves, sawtooth waves, and more. Sampling functions enable users to discretize continuous-time signals for digital signal processing.
matlab
Copy code
% Generate a square wave fs = 1000; % Sampling frequency (Hz) t = 0:1/fs:1; f = 10; % Frequency of the square wave (Hz) y = square(2*pi*f*t); % Plot the signal plot(t, y); xlabel('Time (s)'); ylabel('Amplitude'); title('Square Wave');
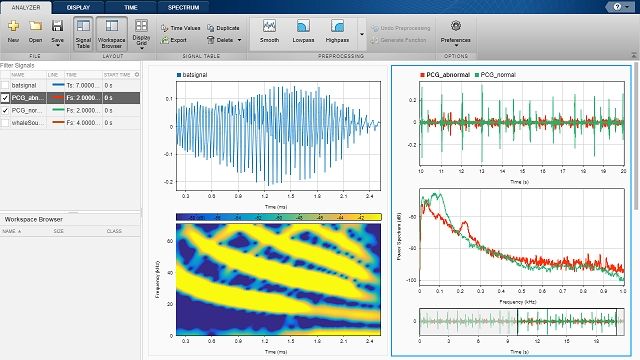
5. Signal Analysis and Visualization
MATLAB provides numerous functions for analyzing and visualizing signals, including plotting, spectrum analysis, statistical analysis, and more.
matlab
Copy code
% Perform spectrum analysis Y = fft(y); frequencies = linspace(0, fs, length(Y)); plot(frequencies, abs(Y)); xlabel('Frequency (Hz)'); ylabel('Magnitude'); title('Frequency Spectrum');
6. Time-Domain Filtering
Time-domain filtering involves modifying the amplitude or phase of a signal in the time domain. Common time-domain filters include low-pass filters, high-pass filters, band-pass filters, and band-stop filters.
matlab
Copy code
% Design and apply a low-pass filter cutoff_frequency = 50; % Cutoff frequency (Hz) [b, a] = butter(4, cutoff_frequency / (fs/2), 'low'); y_filtered = filter(b, a, y); % Plot the filtered signal plot(t, y_filtered); xlabel('Time (s)'); ylabel('Amplitude'); title('Low-Pass Filtered Signal');
7. Frequency-Domain Filtering
Frequency-domain filtering involves modifying the frequency content of a signal using techniques such as convolution, Fourier transform, and spectral analysis.
matlab
Copy code
% Design and apply a frequency-domain filter frequencies = fftshift(linspace(-fs/2, fs/2, length(Y))); H = (abs(frequencies) < 30); % Frequency response of the filter Y_filtered = Y .* H; y_filtered = ifft(Y_filtered); % Plot the filtered signal plot(t, y_filtered); xlabel('Time (s)'); ylabel('Amplitude'); title('Frequency-Domain Filtered Signal');
8. Windowing and Spectral Analysis
Windowing is a technique used to reduce spectral leakage and improve the accuracy of spectral analysis. MATLAB provides various window functions, such as Hamming, Hanning, Blackman, and Kaiser windows.
matlab
Copy code
% Apply windowing to the signal window_size = 128; window = hamming(window_size); y_windowed = y .* window'; % Perform spectral analysis Y_windowed = fft(y_windowed); plot(frequencies, abs(Y_windowed)); xlabel('Frequency (Hz)'); ylabel('Magnitude'); title('Spectral Analysis with Hamming Window');
9. Discrete Fourier Transform (DFT) and Fast Fourier Transform (FFT)
The Discrete Fourier Transform (DFT) and Fast Fourier Transform (FFT) are mathematical algorithms used to compute the frequency-domain representation of a signal efficiently. MATLAB provides the fft function for computing the FFT of a signal.
matlab
Copy code
% Compute the FFT of the signal Y = fft(y); % Plot the magnitude spectrum plot(frequencies, abs(Y)); xlabel('Frequency (Hz)'); ylabel('Magnitude'); title('Magnitude Spectrum (FFT)');
10. FIR and IIR Filter Design
Finite Impulse Response (FIR) and Infinite Impulse Response (IIR) filters are commonly used in signal processing for various applications. MATLAB provides functions for designing FIR and IIR filters, such as fir1, butter, cheby1, ellip, and more.
matlab
Copy code
% Design an FIR low-pass filter order = 64; cutoff_frequency = 50; % Cutoff frequency (Hz) b = fir1(order, cutoff_frequency / (fs/2), 'low'); % Apply the FIR filter to the signal y_filtered = filter(b, 1, y); % Plot the filtered signal plot(t, y_filtered); xlabel('Time (s)'); ylabel('Amplitude'); title('FIR Low-Pass Filtered Signal');
11. Adaptive Filters
Adaptive filters are used to adjust their filter coefficients in real-time based on the input signal. MATLAB provides functions for adaptive filtering, including the Least Mean Squares (LMS) algorithm and the Recursive Least Squares (RLS) algorithm.
matlab
Copy code
% Design an adaptive filter using the LMS algorithm filter_length = 32; mu = 0.1; % Step size [h, e] = lms(y, y_desired, mu, filter_length); % Plot the error signal plot(t, e); xlabel('Time (s)'); ylabel('Error'); title('LMS Adaptive Filter Error');
12. Wavelet Transform
Wavelet transform is a powerful technique for analyzing signals in both time and frequency domains simultaneously.
MATLAB provides functions for wavelet analysis, including continuous wavelet transform (CWT) and discrete wavelet transform (DWT), enabling users to analyze signals with both localized and global properties.
matlab
Copy code
% Perform Continuous Wavelet Transform (CWT) scales = 1:128; cwt(y, scales, 'morl'); xlabel('Time (s)'); ylabel('Scale'); title('Continuous Wavelet Transform');
13. Practical Applications
Signal processing and filtering have numerous practical applications across various domains:
- Audio Processing: Filtering noise, equalization, compression, and effects processing in audio signals.
- Image Processing: Edge detection, denoising, sharpening, and feature extraction in digital images.
- Biomedical Engineering: ECG/EEG signal analysis, medical image processing, and diagnostic systems.
- Communications: Modulation, demodulation, channel equalization, and error correction in wireless communication systems.
- Control Systems: Filtering and noise reduction in feedback control systems for improved stability and performance.
14. Best Practices and Tips
- Understand the Signal: Gain a thorough understanding of the signal characteristics, including its frequency content, noise sources, and intended use.
- Choose the Right Technique: Select the appropriate signal processing technique based on the specific requirements and objectives of the application.
- Preprocess the Data: Clean and preprocess the data before applying signal processing techniques to improve the accuracy and reliability of the results.
- Evaluate Performance: Assess the performance of signal processing algorithms using appropriate metrics and validation techniques.
- Optimize Efficiency: Optimize the implementation of signal processing algorithms for efficiency and computational performance, especially for real-time applications.
15. Conclusion
Signal processing and filtering are essential techniques for analyzing and interpreting signals in various applications. MATLAB provides a comprehensive set of tools and functions for performing signal processing tasks, including signal generation, analysis, filtering, and spectral analysis. By leveraging MATLAB’s capabilities and following best practices, users can effectively process and analyze signals to extract valuable insights and make informed decisions in their respective domains.