Fitting Models and Curves to Data Using MATLAB
Fitting models and curves to data is a fundamental task in data analysis, scientific research, and engineering applications. MATLAB, with its extensive set of built-in functions and toolboxes, provides powerful capabilities for model fitting, enabling users to analyze experimental data, extract meaningful insights, and make predictions based on empirical observations. In this comprehensive article, we will explore various techniques, methods, and best practices for fitting models and curves to data using MATLAB.
Table of Contents
- Introduction to Model Fitting
- Types of Models and Curves
- Linear Regression
- Nonlinear Regression
- Polynomial Curve Fitting
- Custom Model Fitting
- Evaluating Model Fit
- Model Selection and Validation
- Advanced Techniques and Tools
- Practical Applications
- Best Practices and Tips
- Conclusion
1. Introduction to Model Fitting
Model fitting involves finding the best mathematical representation (model) that describes the relationship between input variables (independent variables) and output variables (dependent variables) in a dataset. The goal is to determine the parameters of the model that minimize the difference between the observed data points and the values predicted by the model.
2. Types of Models and Curves
Models and curves fitted to data can vary widely depending on the nature of the data and the underlying relationships being studied. Common types of models include linear models, polynomial models, exponential models, logarithmic models, and custom-defined models.
3. Linear Regression
Linear regression is a simple and widely used method for fitting a linear model to data. In MATLAB, linear regression can be performed using the fitlm function.
matlab
Copy code
% Generate sample data x = 1:10; y = 2*x + randn(size(x)); % Fit a linear model mdl = fitlm(x, y); % Plot data and fitted line scatter(x, y); hold on; plot(mdl); hold off;
4. Nonlinear Regression
Nonlinear regression involves fitting a nonlinear model to data, which may have more complex relationships than linear models. MATLAB provides the fit function for nonlinear regression.
matlab
Copy code
% Define a custom nonlinear model model = @(b, x) b(1) * exp(-b(2) * x); % Fit the model to data b0 = [1, 0.1]; % Initial guess for parameters [b, ~, ~, ~, ~] = nlinfit(x, y, model, b0); % Plot data and fitted curve scatter(x, y); hold on; plot(x, model(b, x)); hold off;
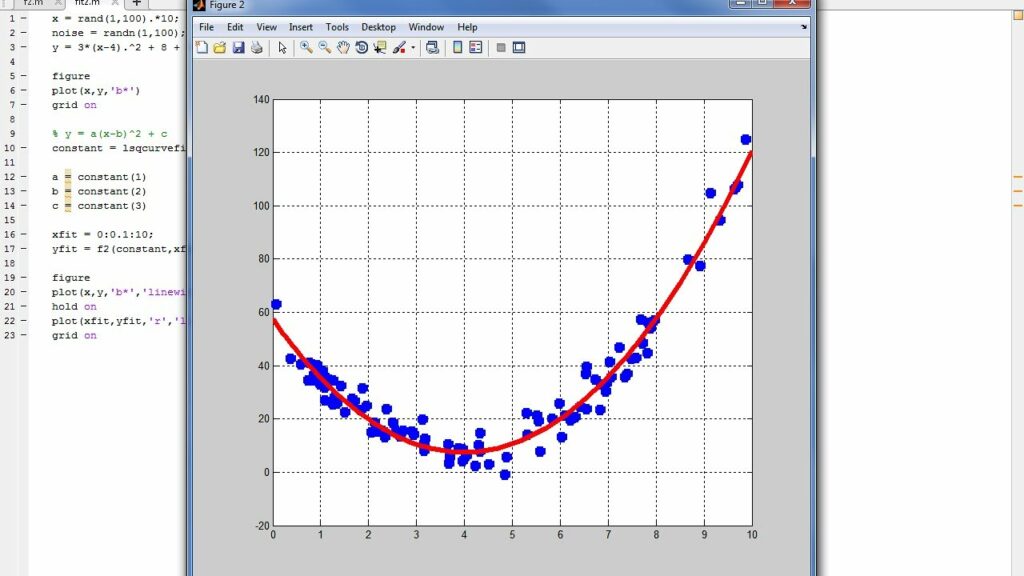
5. Polynomial Curve Fitting
Polynomial curve fitting involves fitting a polynomial function to data. MATLAB provides the polyfit and polyval functions for polynomial regression.
matlab
Copy code
% Fit a polynomial of degree 2 to data p = polyfit(x, y, 2); % Evaluate polynomial at new points x_new = linspace(min(x), max(x), 100); y_pred = polyval(p, x_new); % Plot data and fitted curve scatter(x, y); hold on; plot(x_new, y_pred); hold off;
6. Custom Model Fitting
In addition to built-in models, MATLAB allows users to define custom models and fit them to data using the fit function with custom equations or function handles.
matlab
Copy code
% Define custom model equation model_eqn = 'a * exp(-b * x)'; % Fit the model to data model_fit = fit(x', y', model_eqn); % Plot data and fitted curve plot(model_fit, x, y);
7. Evaluating Model Fit
It is essential to evaluate the goodness of fit of the model to determine its accuracy and reliability. MATLAB provides various metrics and diagnostic plots for evaluating model fit, including R-squared (coefficient of determination), residuals analysis, and confidence intervals.
matlab
Copy code
% Evaluate goodness of fit rsquared = mdl.Rsquared.Ordinary; % Plot residuals plotResiduals(mdl);
8. Model Selection and Validation
Model selection involves comparing multiple models and selecting the one that best explains the data. Cross-validation techniques, such as k-fold cross-validation, can be used to validate the model’s performance and assess its generalization ability.
matlab
Copy code
% Perform k-fold cross-validation cvmdl = crossval(mdl); % Compute cross-validated RMSE rmse_cv = kfoldLoss(cvmdl, 'lossfun', 'mse');
9. Advanced Techniques and Tools
Advanced techniques for model fitting in MATLAB include robust regression, Bayesian methods, regularization techniques (e.g., ridge regression, LASSO), and machine learning algorithms (e.g., decision trees, support vector machines).
matlab
Copy code
% Fit a robust linear model mdl_robust = fitlm(x, y, 'RobustOpts', 'on'); % Train a decision tree model tree = fitrtree(X, y);
10. Practical Applications
Model fitting has diverse applications across various fields, including:
- Predictive modeling in finance and economics
- Trend analysis in climate science and environmental research
- Pharmacokinetic modeling in pharmacology and drug development
- Curve fitting in engineering and signal processing
- Growth modeling in biology and population dynamics
11. Best Practices and Tips
- Understand the Data: Gain a thorough understanding of the data and the underlying relationships before selecting a fitting method.
- Choose the Right Model: Select a model that best captures the underlying patterns and relationships in the data.
- Evaluate Model Assumptions: Ensure that the assumptions of the chosen model are met and validated.
- Perform Sensitivity Analysis: Assess the sensitivity of the model to variations in parameters and assumptions.
- Document the Process: Document all steps involved in model fitting, including data preprocessing, model selection, and validation.
12. Conclusion
Fitting models and curves to data is a fundamental task in data analysis and scientific research. MATLAB provides a comprehensive set of tools and functions for model fitting, enabling users to analyze complex datasets, extract meaningful insights, and make informed decisions based on empirical observations. By following best practices, selecting appropriate models, and evaluating model performance, users can effectively fit models and curves to data and derive valuable insights from their analyses.